Visual Pipeline Builder
Design a workflow agent by dragging nodes onto a canvas, connecting them, and configuring each one. The builder is a ReactFlow canvas: what you draw is the agent’s execution graph, run left to right at invocation time.
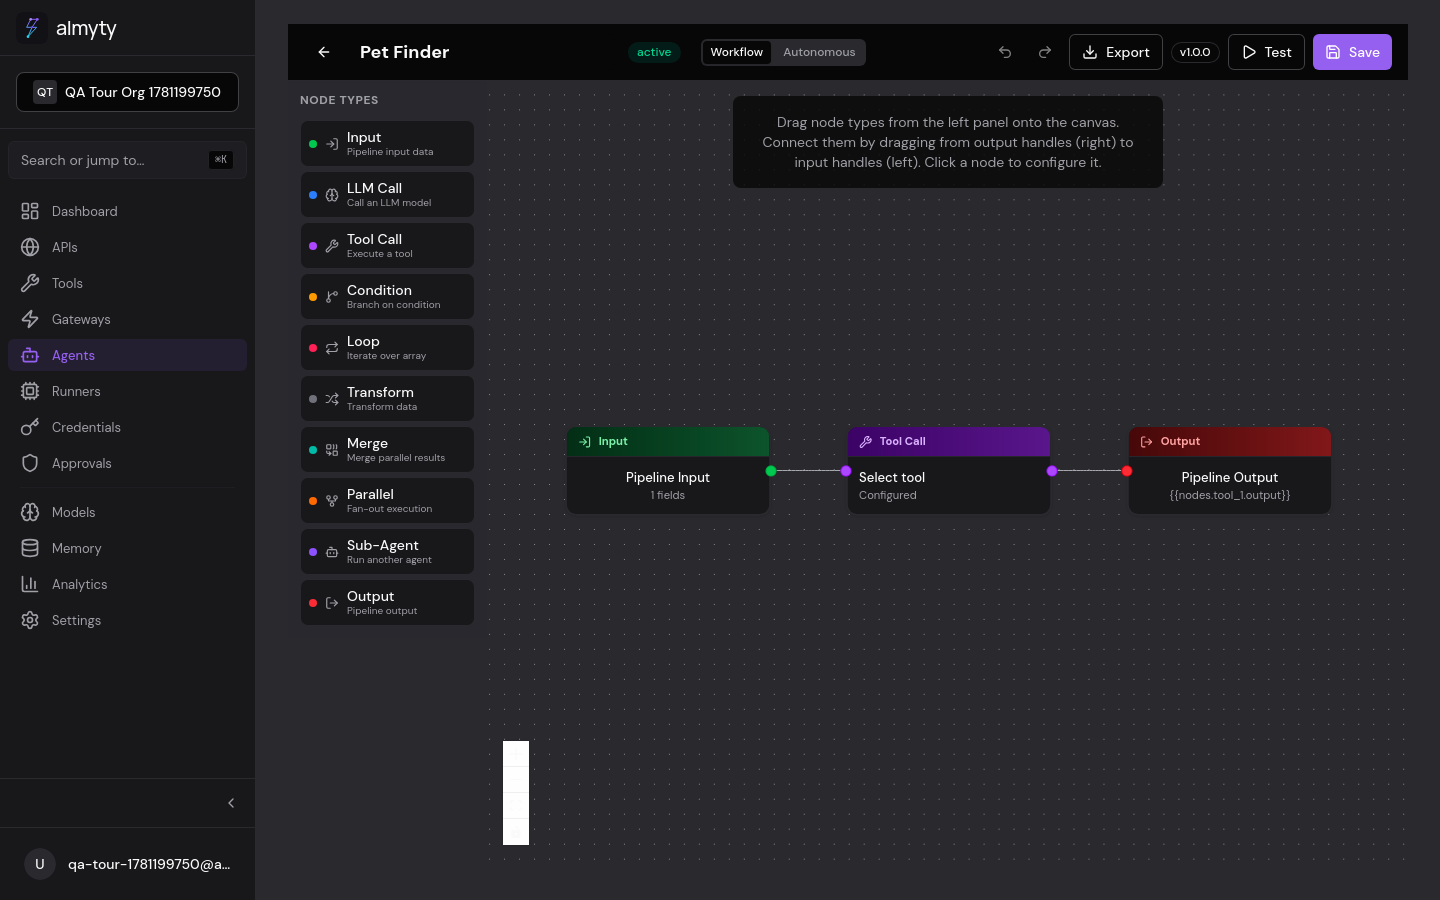
Interface Overview
The builder has three main areas:
| Area | Location | Purpose |
|---|---|---|
| Node Palette | Left panel | Lists all 10 node types available to drag onto the canvas |
| Canvas | Center | The DAG workspace where you arrange and connect nodes |
| Node Config Panel | Right panel (opens on node click) | Configure the selected node’s properties |
Two tabs at the top switch between Workflow (visual DAG) and Autonomous (form-based) modes.
Build a pipeline
Add nodes
Find the node type you need in the Node Palette on the left and drag it onto the canvas. It appears with default configuration and unconnected handles.
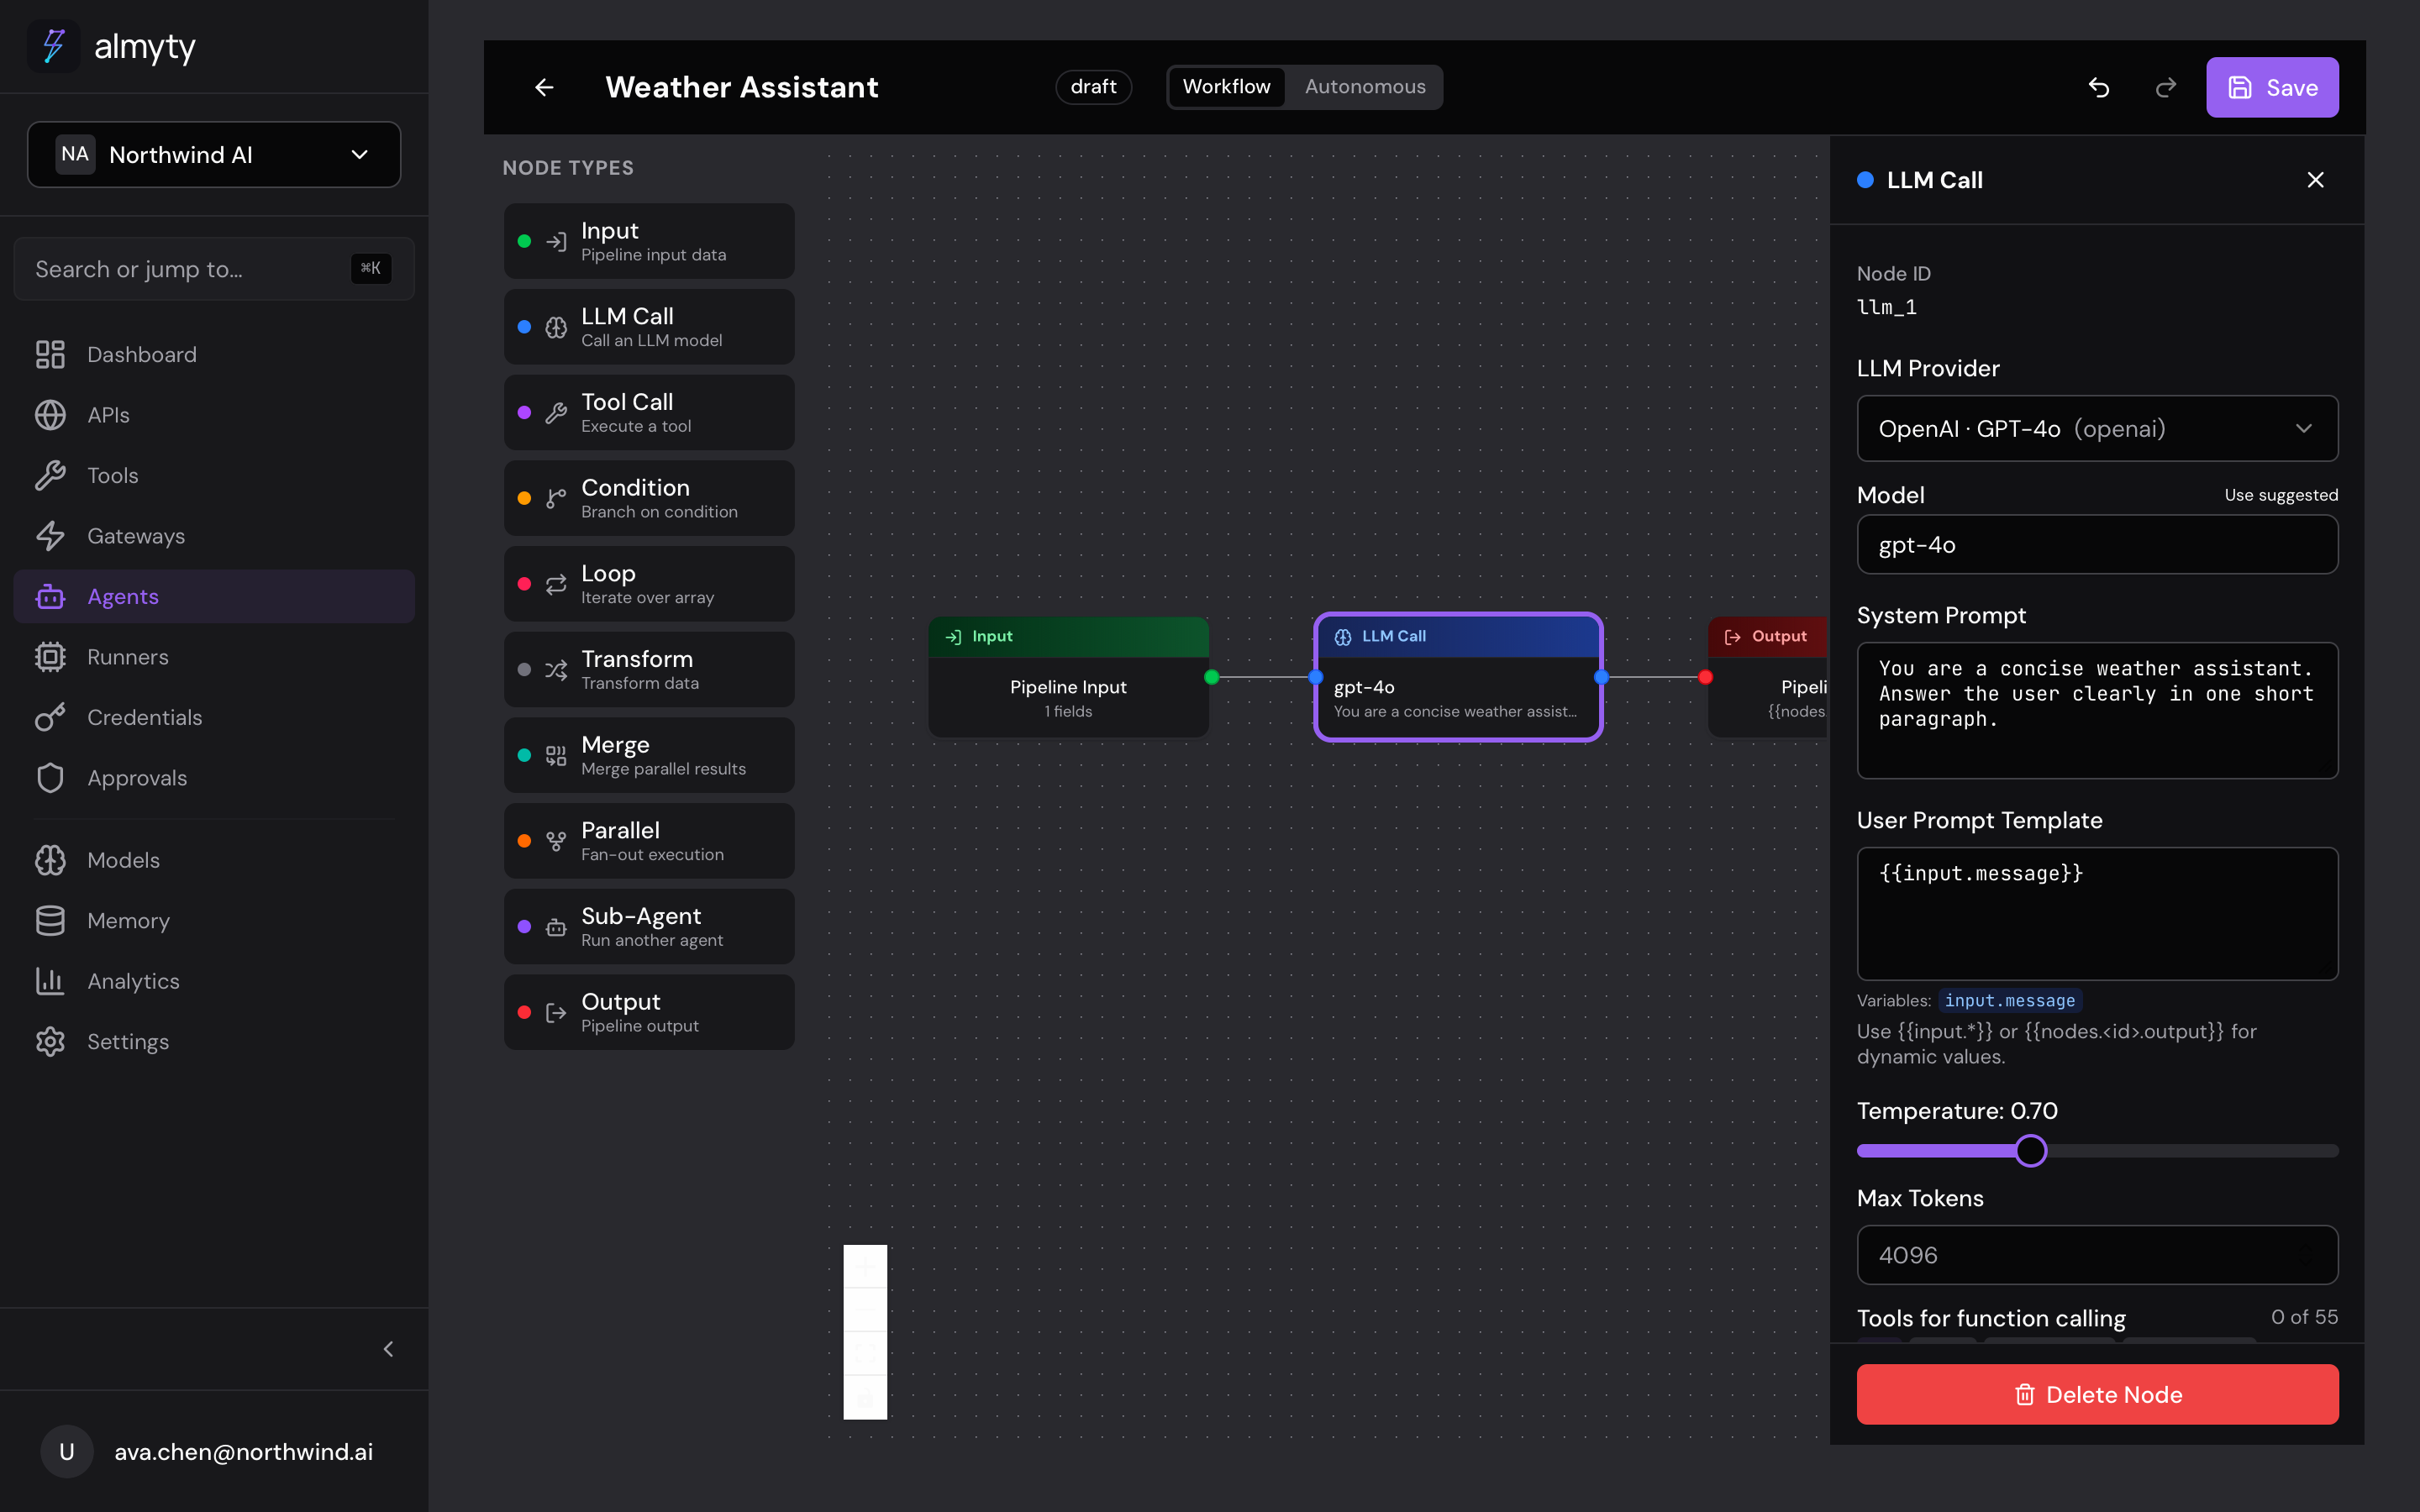
Connect nodes
Hover a node’s output handle (right side), then click and drag to another node’s input handle (left side) and release to create an edge. Data flows left to right along edges at execution time. To remove a connection, click the edge and press Delete or Backspace.
Configure a node
Click any node to open the Node Config Panel on the right, then fill in the required fields (they vary by node type). Changes save to the draft automatically.
Save and test
- Click Save in the top bar to persist the pipeline
- Validation runs automatically: nodes with errors show a red border (see Pipeline Validation)
- Fix any issues listed in the error panel at the bottom
- Click Test to open the test drawer, provide sample input, and run the pipeline
- Review the output and per-node execution details in the test results
Once the agent is active, run it from your terminal:
$ npx @almyty/agents run invoice-pipeline \
    --input '{"file_url": "https://example.com/invoice.pdf"}'
See the Agents CLI for --watch, --json, and more.
Node Types
The palette contains all 10 node types. Each has a distinct color on the canvas for quick identification.
| Node Type | Purpose |
|---|---|
| Input | Entry point: defines the JSON Schema for incoming data |
| Output | Exit point: maps the final result from upstream nodes |
| LLM Call | Sends a prompt to an LLM provider and returns the response |
| Tool Call | Invokes a tool with explicit parameter mapping |
| Condition | Branches the pipeline based on a boolean expression (true/false edges) |
| Transform | Runs sandboxed JavaScript to reshape data |
| Loop | Iterates over an array, running child nodes for each item |
| Parallel | Executes multiple branches simultaneously and aggregates results |
| Merge | Combines outputs from multiple upstream nodes into a single value |
| Sub-Agent | Invokes another agent as a step in this pipeline |
See Node Types for full configuration details on each.
Workflow vs Autonomous Mode
Workflow Mode
The visual DAG shown above. You explicitly define every step, connection, and data transformation. Best for deterministic, repeatable pipelines where you need full control over execution order.
Autonomous Mode
Switching to the Autonomous tab replaces the canvas with a form:
- System Instructions: free-text prompt describing the agent’s behavior
- Tools: select which tools the agent can call
- Memory: toggle persistent memory across conversations
- Collaboration: optionally connect other agents for delegation
The LLM decides at runtime which tools to call and in what order. Best for open-ended tasks where rigid sequencing is unnecessary. See Autonomous agents.
Canvas Controls
| Action | Shortcut |
|---|---|
| Pan | Click and drag on empty canvas |
| Zoom | Scroll wheel or pinch |
| Select multiple | Shift + click, or drag a selection box |
| Delete selected | Delete or Backspace |
| Undo | Ctrl/Cmd + Z |
| Redo | Ctrl/Cmd + Shift + Z |
The pipeline object
The graph you draw maps directly to a pipeline object of nodes and edges.
This is what export/import produces, and what the builder stores:
{
  "pipeline": {
    "nodes": [
      { "id": "input_1", "type": "input", "data": { "schema": { "type": "object", "properties": { "query": { "type": "string" } }, "required": ["query"] } } },
      { "id": "llm_1", "type": "llm_call", "data": { "providerId": "provider-uuid", "userPromptTemplate": "Answer: {{input.query}}" } },
      { "id": "output_1", "type": "output", "data": { "mapping": "{{nodes.llm_1.output}}" } }
    ],
    "edges": [
      { "id": "e1", "source": "input_1", "target": "llm_1" },
      { "id": "e2", "source": "llm_1", "target": "output_1" }
    ]
  }
}
Each node’s canvas position is stored in its position field ({ x, y }) and is
included in export/import payloads.